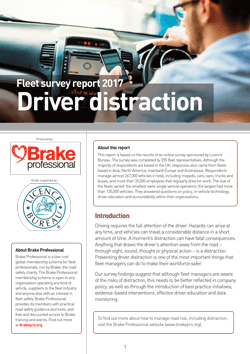
This report is based on the results of an online survey sponsored by Licence Bureau.
The survey was completed by 355 fleet representatives. Although the majority of respondents are based in the UK, responses also came from fleets based in Asia, North America, mainland Europe and Australasia.
Respondents manage almost 267,000 vehicles in total, including mopeds, cars, vans, trucks and buses, and more than 35,000 employees that regularly drive for work.
The size of the fleets varied: the smallest were single-vehicle operators; the largest had more than 135,000 vehicles. They answered questions on policy, in-vehicle technology, driver education and accountability within their organisations.
To see the insightful report please click here, or on the graphic below.
Why is driver distraction so important
- In 2016, failing to look properly was identified as a contributory factor in 37% of crashes that caused death or serious injury in Great Britain.
- In the USA, 3,450 people were killed in crashes involving distracted drivers in 2016.
- A European Commission study has estimated that road user distraction contributes to between 10 and 30% of crashes.
2017 Fleet Safety Survey
- 355 professionals surveyed
- These respondents manage 267,000 vehicles in total
- Covers policies that affect 35,000 employees
- Responses from Asia, North America, mainland Europe, and Australasia as well as the UK
- From single vehicles to fleets of 135,000
Key findings from the survey:-
Policies
- 71% – Respondents that have implemented policies aimed at preventing driver distraction at the wheel
Types of distraction:
Mobile Phones
- 91% have banned the use of hand-held mobile phones while driving
- 32% have restricted the use of hands-free phones
- 57% Respondents were unaware that it can take drivers about 30 seconds to regain full attention after using an information system such as a phone or other device
In-vehicle technology
- 93% – Percentage of fleets that use in vehicle technology
- 43% – Percentage that instruct drivers not to adjust, or communicate using, any technology installed in their vehicle while driving
Eating & drinking
- 98 – Number of fleets that ban eating and drinking at the wheel
Music
- 24 – Number of fleets that have banned drivers from listening to loud music
Smoking
- 64% – Survey respondents that have a policy that forbids drivers from smoking at the wheel of a company vehicle
Passenger Interaction
- 47 – The number of fleets that insist that drivers keep interaction with passengers to a minimum
Grooming
- 74 – Number of fleets that have banned grooming at the wheel
Driver monitoring
- More than a third of organization’s surveyed do not monitor driver distraction levels
- Of those that do, 66 fleets have introduced a ‘self-reporting’ system that requires the driver to be aware of and admit to any wrong-doing
Driver Education
- 26% – Percentage of the fleets surveyed don’t run any driver education/awareness sessions aimed at the topic of driver distraction
So what can we do?
- Educate drivers on all distractions
- Have appropriate policies in place against distractions
- Help drivers keep to these policies
- Enforce policies, by vehicle spot checks and disciplinary action
- Effectively communicate policies to drivers & managers
- Run anonymous staff surveys to measure engagement with road safety messages and compliance with policies


